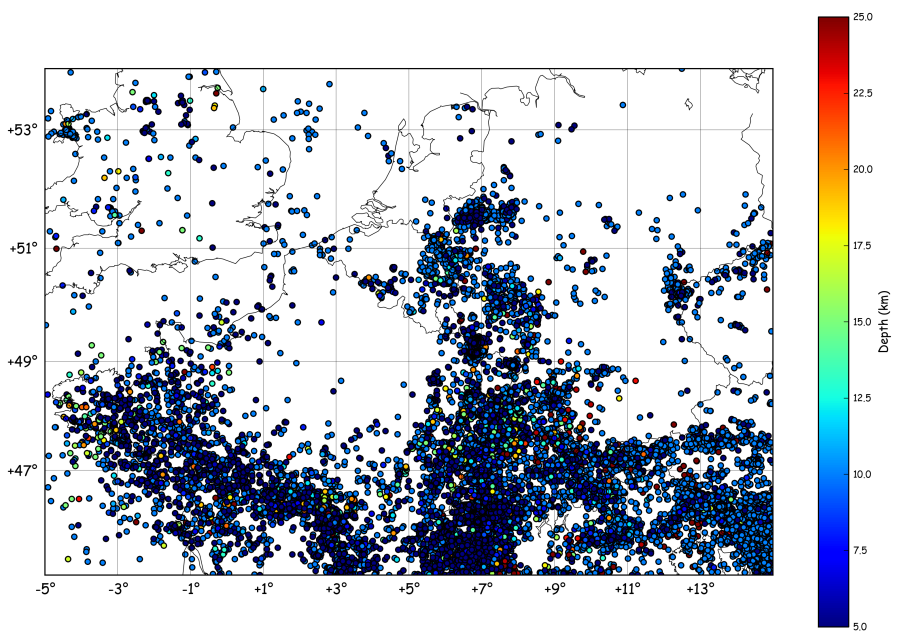
Imagine we want to plot a map of the seismic activity in NW-Europe and, at the same time, count the number events per month. To get a catalogue of earthquakes in the region, one can call the NEIC (note: this…
Thomas Lecocq @ the Royal Observatory of Belgium
Imagine we want to plot a map of the seismic activity in NW-Europe and, at the same time, count the number events per month. To get a catalogue of earthquakes in the region, one can call the NEIC (note: this…

Following the comments on this year-old post I’ve had a look at pyshp which seems a little more maintained (the last line in the changelog is 1 year old…), and it is indeed a quite nice piece of code. I…
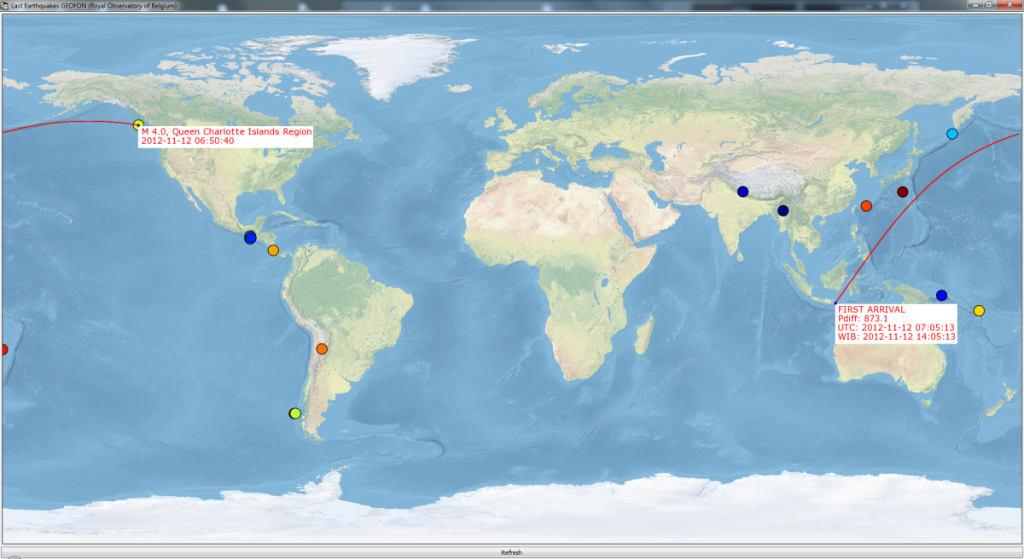
While in Indonesia last July, I created a small tool for the Kawah Ijen observers to allow them to search and plot teleseismic events and to calculate theoretical arrival times of the waves at the Ijen stations. It took roughly…
Everyone used to search for code snippets on the web know the importance of a “Gallery” linking to all examples and tutorials… So, here is my really ugly Gallery :
In the previous tutorial, I defined a “shoot” method to compute the landing point of a shoot from one point, to a given azimuth and distance. Using this logic, it’s possible to find the points situated at a given distance…
Following a question from Ricardo Gama (see his comment), I’ve prepared this new tutorial. He wondered if Basemap has a function similar to the track1 function in matlab (you know, that crappy costly thing…)… Here is what I obtained :…
Dear visitors, I’m always searching new ideas of preparing new tutorials for things doable with Basemap, but I’d like these examples to be as useful as possible, which means : If you have something you would like to appear here,…
New version here Following a question in the matplotlib mailing list, I dug inside the code of readshapefile, in order to gain power : The goal: The data: http://www.gadm.org/ saved inside a new “borders/” folder ! The idea: Opening a…
Here is the trick (well documented on the matplotlib webpage) to define the font family and size of what appears on your matplotlib plot:
Here is a new tutorial that will include “a bit of all” tutorials previously published on this blog and some new cool stuff to play with ! Idea: Find some resources on the Internet and plot them on the map…
Hi folkes, Following a question by Gui on this website, I checked the “how to” draw pie charts on a basemap plot ! Here below I generalise the example given by Manuel Metz on the matplotlib website. The idea is…
# remember to define the ax instance : ax = plt.subplot(111) zone = “Roetgen – Monschau” x,y = m(6.15,50.41) x2,y2 = m(6.59,50.67) x3,y3 = m(6.34,50.855) x4,y4 = m(5.83,50.65) data = np.array(([x,x2,x3,x4], [y,y2,y3,y4])) p = Polygon(data.T,edgecolor=’red’,linewidth=1.5,facecolor=’none’) ax.add_artist(p) Note that we have…
Here, we will focus on adding a “zoom box” on the top left corner of the plot. But before that, we will mask a part of the earthquakes, in order to have a “cleaner” map ! This is achieved by…
Now, let’s imagine we have a dataset containing latitude/longitudes of earthquakes, plus their depth and magnitude. Of course, you don’t always have this dataset available, so let’s build a fake one : import numpy as np lon = np.random.random_integers(11,79,1000)/10. lat…
# # BaseMap example by geophysique.be # tutorial 01 from mpl_toolkits.basemap import Basemap import matplotlib.pyplot as plt import numpy as np fig = plt.figure(figsize=(11.7,8.3)) #Custom adjust of the subplots plt.subplots_adjust(left=0.05,right=0.95,top=0.90,bottom=0.05,wspace=0.15,hspace=0.05) ax = plt.subplot(111) #Let’s create a basemap around Belgium m…