Our Belgian Earthquake Emergency Report System (BEERS) detects abnormal visitor fluxes on the http://www.seismologie.be website and sends emails & SMS whenever some threshold is met. Recently, we have upgraded our sms machinery to FoxBox and for some weird reasons, the…
Category: Tips & Tricks
Jacknife
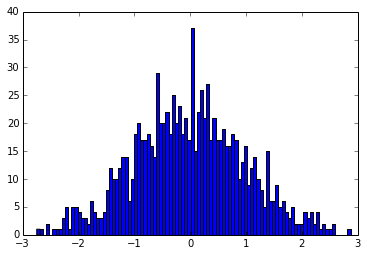
The Jacknife is also sometimes called the “Leave One Out” method, and is a method to somehow evaluate the stability of statistics done on data. By leaving one element out of the input array and studying the mean of the…
Old 16bit DOS programs on Windows 7 (x64)
We needed to execute an old-but-working 16bits program to locate earthquakes called “HypoEllipse” (source), but calling it from the Windows 7 x64 boxes resulted in a nice : Bam ! Not working, sorry for you… No ! I say No…
Matplotlib & Datetimes – Tutorial 04: Grouping & Analysing Sparse Data
To extend the previous tutorial (see here), we define a data array that has some information about the event that occurred for each datetime. The plot of data vs time now looks like: The data array is constructed with numpy.random:…
Matplotlib & Datetimes – Tutorial 03: Grouping Sparse Data
New tutorial, more advanced this time ! Let’s say we have a number of observations, like occurrences of earthquakes, or visitors connecting to a webserver, etc. These observations don’t occur every second, they are sparse on the time axis. To…
Matplotlib & Datetimes – Tutorial 02: Bar Plot
To add some interesting information to the previous tutorial, I’ve downloaded the number of licence plates given for new cars in Belgium for the same time span: 2005 587764 2006 633570 2007 644313 2008 652590 2009 571001 2010 642086 2011…
Matplotlib & Datetimes – Tutorial 01: Fuel Prices
Anyone who has played a little with dates know how painful it can be… Even more when you want to plot this data !! Matplotlib provides (link) a dates API, but to be honnest, even if the documentation is well…
Matplotlib Basemap tutorial 07: Shapefiles unleached
New version here Following a question in the matplotlib mailing list, I dug inside the code of readshapefile, in order to gain power : The goal: The data: http://www.gadm.org/ saved inside a new “borders/” folder ! The idea: Opening a…
Matplotlib Fonts (plots, basemaps, etc.)
Here is the trick (well documented on the matplotlib webpage) to define the font family and size of what appears on your matplotlib plot:
Numpy Trick 01
I usually forget how much Numpy makes life easy : Say, you have a 101 element array, e.g.: import numpy as np a = np.linspace(0,100,101) and you want to take every 4th item in that array, that’s as easy as…