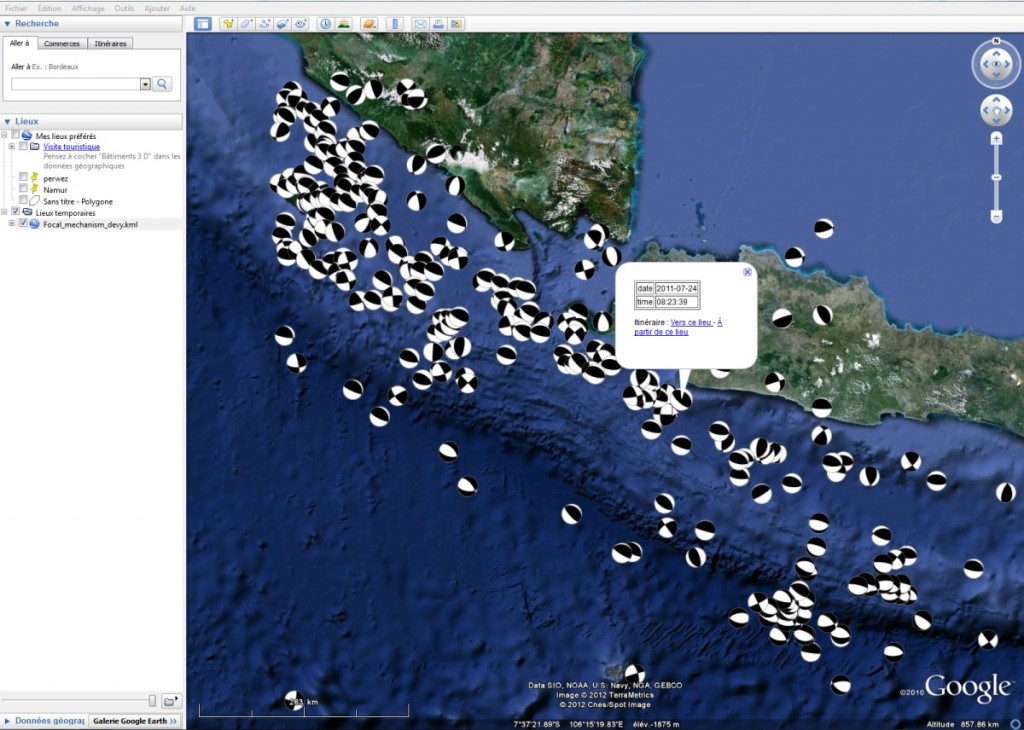
Plotting focal mechanisms in Google Earth is an annoying task to do manually. I wrote a script to convert a text file to beach balls using the obspy package and then to create the corresponding KML file. Each ball is a symbol, used by one Placemark. Below, you’ll see a view of the beachball plot result. The behaviour is the same as for normal placemarks. If beachballs are overlapping, you can spread them by simply clicking on the cluster. When the icon scale factor is small, by zooming in, the number of overlapping icons will decrease. It is easy to add information in the table that appears when clicking on the beachball.
The full code is after the break:
#!/usr/bin/python

#~ warning !: the script will draw beachball and creates the kml file to plot them in googleearth. All created element
#~ will be placed in the same directory as the one containing this script. The kml file and the beachballs have to
#~ stay in the same directory.

from lxml import etree      #will manage the identation of the kml script
from pykml.factory import KML_ElementMaker as KML #import pykml library
import numpy as np
import datetime as date

def beachball(data):
    """function to draw beachball using obspy library"""
    import matplotlib.pyplot as plt
    from obspy.imaging.beachball import Beachball

    strike,dip,rake=data[:,9],data[:,10],data[:,11]
    event=data[:,0]                 #index to identify the beachball created

    for j in range(len(strike)):
        beach = Beachball([strike[j],dip[j],rake[j]],outfile=str(int(event[j])),\
            facecolor='black',edgecolor='black') #create and save beachball in a outfile in the directory where the .py file is

data=np.loadtxt('path\table_w_your_data.txt',\
    skiprows=1) #import your data. (table format: index yyyy mm dd hr mn ss lat lon strike dip rake) the first row isn't used
latitude = data[:,7]
longitude = data[:,8]
yyyy,mm,dd=data[:,3],data[:,2],data[:,1]
hr,mn,ss = data[:,4],data[:,5],data[:,6]
index=data[:,0]

beachball(data)         #call beachball function   --> put in comment this line if you don't want to draw again all beachballs

###############################################################################################################################
# create a document element with multiple label style
kmlobj = KML.kml(
    KML.Document(
    )
)

for j in range(len(yyyy)):  #create the ref icons we will use
    kmlobj.Document.append(
        KML.Style(
            KML.IconStyle(
                KML.Icon(
                    KML.href('%s.png'%str(int(index[j]))),
                    KML.scale(0.6),   #scale the beachball in googleEarth
                ),
                KML.heading(0.0),
            ),
        id='beach_ball_%i'%j    #gives the icon a ref that will be used later
        ),
    )

# add images to the document element
for i in range(len(yyyy)):
    datum = str(date.date(int(yyyy[i]),int(mm[i]),int(dd[i])))
    ev_time = str(date.time(int(hr[i]),int(mn[i]),int(ss[i])))

    kmlobj.Document.append(
        KML.Placemark(
            #~ KML.name('%s'%str(int(index[i]))),   #uncomment this to add a name to the placemark (will always appear in GoogleEarth)
            KML.ExtendedData(                       #I add information about the earthquake, it appears in a table ('info' : value)
                KML.Data(
                    KML.value('%s'%datum),          #add value of the specific info
                name ='date'                        #name of'info' you add.
                ),
                KML.Data(
                    KML.value('%s'%ev_time),        #add value of the specific info
                name ='time'                        #name of 'info' you add.
                ),                                     #more data can be added, following the same structure (line 65-68)
            ),
            KML.styleUrl('#beach_ball_%i'%i),       #get the correct beachball in the directory as marker
            KML.Point(
                KML.coordinates(longitude[i],',',latitude[i]),
            ),

        ),
    )

print etree.tostring(etree.ElementTree(kmlobj),pretty_print=True)
outfile= file('Focal_mechanism_devy.kml','w') #save the kml structure code
outfile.write(etree.tostring(kmlobj, pretty_print=True))


Dimitri,
nice tool!
One comment: you should change line 28 into:
yyyy,mm,dd=data[:,1],data[:,2],data[:,3]
Is it possible to add a line to keep the beachball fixed to the north? Now if you rotate in Google Earth, also the beachball turns.
Cheers, Koen
Dimitri,
Very nice tool! I’m interested to use it, but I think my data is not formatting in a way that numpy likes, I’m getting the following error:
Traceback (most recent call last):
File “C:\Python27\DrawFMinGE.py”, line 26, in
latitude=data[:,7]
IndexError: invalid index
Can you recommend exactly how the .txt file should be formatted?
Thanks,
Erik
Hello Erik,
The file format is explained in comment line 25. The 8th column (data[:,7] in python counting system) is the latitude.
table format: index yyyy mm dd hr mn ss lat lon strike dip rake
corresponding column value in python 0 1 2 3 4 5 6 7 8 9 10 11
let me know if it you have any other problems,
Dimitri
Dimitri,
Thanks for responding. I don’t have much experience with Python, so I spent significant time yesterday educating myself on some basics. I still have no idea why I’m getting that “invalid index” error. I’m sure I’m missing something very simple and basic, but I don’t know what it is.
The .txt file I’m trying to use only contains information on one focal mechanism (a test case). The entire contents of my .txt file are:
index yyyy mm dd hr mn ss lat lon strike dip rake
1 1978 11 29 14 37 50 30.57 -114.73 189 35 122
In case formatting didn’t come through, there is a single space between each column a single return separating row 1 (header) from row 2 (data). What have I got wrong here?
Many thanks,
Erik
Did anyone ever figure a way to keep the focal mechanisms fixed north?
Also, I get the following error when I uncomment line 68 (to add a placemark):
~ KML.name(‘%s’%str(int(index[i]))), #uncomment this to add a name to the placemark (will always appear in GoogleEarth)
TypeError: bad operand type for unary ~: ‘lxml.objectify.ObjectifiedElement’
Any thoughts?
Cheers,
JH
Hi Jim,
The error comes because the comment has been defined as “# ~” in ScITE, the editor we used before. Remove the space and tilde and all should go OK !
Reading this: (https://code.google.com/p/earth-api-samples/issues/detail?id=131) it seems Icon elements support the definition , so check the code above, I’ve updated it, it seems to work for me !
COuld you put here a sample txt file which includes at least one line input file?
Thanks
the error is
python beachball.py
Traceback (most recent call last):
File “beachball.py”, line 26, in
latitude = data[:,7]
IndexError: too many indices
Hello Mustafa !
the format is:
Line 25: #table format: index yyyy mm dd hr mn ss lat lon strike dip rake) the first row isn’t used
let me know how it goes
Actually I have made it. then the next message appeared as
python beachball.py
Traceback (most recent call last):
File “beachball.py”, line 26, in
latitude = data[:,7]
IndexError: too many indices
Mustafa,
it should work if you respected the format I mentionned. it might be a delimiter issue, or you don’t have 8 columns in the text file.
You can test it works by adding a “print data” just above the line 26.
sorry for that.
I am trying to respect the format.. print data give me this output.
python beachball.py
[ 1.00000000e+00 1.97800000e+03 1.10000000e+01 2.90000000e+01
1.40000000e+01 3.70000000e+01 5.00000000e+01 3.00000000e+01
-1.14000000e+02 1.89000000e+02 3.50000000e+01 1.22000000e+02]
Traceback (most recent call last):
File “beachball.py”, line 27, in
latitude = data[:,7]
IndexError: too many indices
After I delete the first character for index. the out put is
ustafa@mcomoglu:~$ python beachball.py
[ 2014. 11. 29. 14. 37. 50. 36. 33. 189. 35.
122.]
Traceback (most recent call last):
File “beachball.py”, line 27, in
latitude = data[:,7]
IndexError: too many indices
do you have more than one line ?
No extra line. I obey to the format that I have in the example. Let s talk in the meeting in Bucharest.
Thanks for the clarifying the things. It works fine now. One thing already we discussed is if it s possible It would be fine to give a name with the new version to the png files a combination of YYYYMMDDHHMMSS? I am adding the name as I described semi automatically.
Thanks again.
Thank you for this really useful program. I learned enough about Python, which I had not used before, in a few hours to run the program and adapt it to add a few features (e.g. coloured beachballs for different fault types, display depth in info box). It is also easy to convert the kml output file to shapefile format for ArcGIS, using the Arc Toolbox, join the new shapefile to the original data file, and display the beachballs in ArcMap with their attributes.