Following a question from Ricardo Gama (see his comment), I’ve prepared this new tutorial. He wondered if Basemap has a function similar to the track1 function in matlab (you know, that crappy costly thing…)…
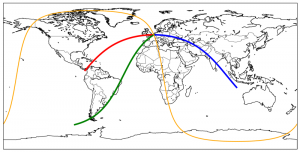
Here is what I obtained :

The goal:
Plotting great circles with Basemap, but knowing only the longitude, latitude, the azimuth and a distance. Only the origin point is known.
The process:
Instead of modifying (for now) the basemap package, I’ve translated a routine I found on the internet. Ed Williams wrote very good scripts for shooting great circles (see his website : http://williams.best.vwh.net/gccalc.htm). Note, I haven’t contacted Ed, so, please note this code is the property of Ed, I’ve just translated the script.
The process:
I defined a function call “shoot” that takes longitude, latitude, azimuth and the distance until which the great circle needs to be drawn. The function returns the longitude and latitude of the second point, allowing you to call the regular m.drawgreatcircle()
The only thing to do is to call that function, get the second point’s lon/lat and plot the draw the great circle :
glon1 = 4.360515
glat1 = 50.79747
azimuth = 270.
maxdist = 20000

glon2, glat2, backazimuth = shoot(glon1, glat1, azimuth, maxdist)
m.drawgreatcircle(glon1, glat1, glon2, glat2,del_s=50,color='red', lw=4.)
Note, with this code, if you input a too long maxdist, the smallest great circle is plotted…
To plot the great circle until you cross the -180/+180° limit, one can set up a function like:
def great(m, startlon, startlat, azimuth,*args, **kwargs):
    glon1 = startlon
    glat1 = startlat
    glon2 = glon1
    glat2 = glat1

    step = 50

    glon2, glat2, baz = shoot(glon1, glat1, azimuth, step)
    if azimuth-180 >= 0:
        while glon2 <= startlon:
            m.drawgreatcircle(glon1, glat1, glon2, glat2,del_s=50,**kwargs)
            azimuth = baz + 180.
            glat1, glon1 = (glat2, glon2)

            glon2, glat2, baz = shoot(glon1, glat1, azimuth, step)
    elif azimuth-180 < 0:
        while glon2 >= startlon:
            m.drawgreatcircle(glon1, glat1, glon2, glat2,del_s=50,**kwargs)
            azimuth = baz + 180.
            glat1, glon1 = (glat2, glon2)

            glon2, glat2, baz = shoot(glon1, glat1, azimuth, step)
for which you only have to provide the starting lat/lon, the starting azimuth. This function expects the basemap (m) as first arg. It will compute the locations along the great circle every “step” distance.
The code is after this break:
#
# BaseMap example by geophysique.be
# tutorial 08
from mpl_toolkits.basemap import Basemap
import matplotlib.pyplot as plt

import numpy as np

### PARAMETERS FOR MATPLOTLIB :
import matplotlib as mpl
mpl.rcParams['font.size'] = 10.
mpl.rcParams['font.family'] = 'Comic Sans MS'
mpl.rcParams['axes.labelsize'] = 8.
mpl.rcParams['xtick.labelsize'] = 6.
mpl.rcParams['ytick.labelsize'] = 6.

def shoot(lon, lat, azimuth, maxdist=None):
    """Shooter Function
    Original javascript on http://williams.best.vwh.net/gccalc.htm
    Translated to python by Thomas Lecocq
    """
    glat1 = lat * np.pi / 180.
    glon1 = lon * np.pi / 180.
    s = maxdist / 1.852
    faz = azimuth * np.pi / 180.

    EPS= 0.00000000005
    if ((np.abs(np.cos(glat1))<EPS) and not (np.abs(np.sin(faz))<EPS)):
        alert("Only N-S courses are meaningful, starting at a pole!")

    a=6378.13/1.852
    f=1/298.257223563
    r = 1 - f
    tu = r * np.tan(glat1)
    sf = np.sin(faz)
    cf = np.cos(faz)
    if (cf==0):
        b=0.
    else:
        b=2. * np.arctan2 (tu, cf)

    cu = 1. / np.sqrt(1 + tu * tu)
    su = tu * cu
    sa = cu * sf
    c2a = 1 - sa * sa
    x = 1. + np.sqrt(1. + c2a * (1. / (r * r) - 1.))
    x = (x - 2.) / x
    c = 1. - x
    c = (x * x / 4. + 1.) / c
    d = (0.375 * x * x - 1.) * x
    tu = s / (r * a * c)
    y = tu
    c = y + 1
    while (np.abs (y - c) > EPS):

        sy = np.sin(y)
        cy = np.cos(y)
        cz = np.cos(b + y)
        e = 2. * cz * cz - 1.
        c = y
        x = e * cy
        y = e + e - 1.
        y = (((sy * sy * 4. - 3.) * y * cz * d / 6. + x) *
              d / 4. - cz) * sy * d + tu

    b = cu * cy * cf - su * sy
    c = r * np.sqrt(sa * sa + b * b)
    d = su * cy + cu * sy * cf
    glat2 = (np.arctan2(d, c) + np.pi) % (2*np.pi) - np.pi
    c = cu * cy - su * sy * cf
    x = np.arctan2(sy * sf, c)
    c = ((-3. * c2a + 4.) * f + 4.) * c2a * f / 16.
    d = ((e * cy * c + cz) * sy * c + y) * sa
    glon2 = ((glon1 + x - (1. - c) * d * f + np.pi) % (2*np.pi)) - np.pi

    baz = (np.arctan2(sa, b) + np.pi) % (2 * np.pi)

    glon2 *= 180./np.pi
    glat2 *= 180./np.pi
    baz *= 180./np.pi

    return (glon2, glat2, baz)

def great(m, startlon, startlat, azimuth,*args, **kwargs):
    glon1 = startlon
    glat1 = startlat
    glon2 = glon1
    glat2 = glat1

    step = 50

    glon2, glat2, baz = shoot(glon1, glat1, azimuth, step)
    if azimuth-180 >= 0:
        while glon2 <= startlon:
            m.drawgreatcircle(glon1, glat1, glon2, glat2,del_s=50,**kwargs)
            azimuth = baz + 180.
            glat1, glon1 = (glat2, glon2)

            glon2, glat2, baz = shoot(glon1, glat1, azimuth, step)
    elif azimuth-180 < 0:
        while glon2 >= startlon:
            m.drawgreatcircle(glon1, glat1, glon2, glat2,del_s=50,**kwargs)
            azimuth = baz + 180.
            glat1, glon1 = (glat2, glon2)

            glon2, glat2, baz = shoot(glon1, glat1, azimuth, step)

fig = plt.figure(figsize=(11.7,8.3))

#Custom adjust of the subplots

plt.subplots_adjust(left=0.05,right=0.95,top=0.90,bottom=0.05,wspace=0.15,hspace=0.05)

ax = plt.subplot(111)

#Let's create a basemap of the world

m = Basemap(resolution='l')
m.drawcountries()
m.drawcoastlines()

glon1 = 4.360515
glat1 = 50.79747

azimuth = 270.
maxdist = 9000
glon2, glat2, baz = shoot(glon1, glat1, azimuth, maxdist)
m.drawgreatcircle(glon1, glat1, glon2, glat2,del_s=50,color='red', lw=4.)

azimuth = 90.
maxdist = 12000
glon2, glat2, baz = shoot(glon1, glat1, azimuth, maxdist)
m.drawgreatcircle(glon1, glat1, glon2, glat2,del_s=50,color='blue', lw=4.)

azimuth = 225.
maxdist = 15000
glon2, glat2, baz = shoot(glon1, glat1, azimuth, maxdist)
m.drawgreatcircle(glon1, glat1, glon2, glat2,del_s=50,color='green', lw=4.)

startlon = 4.360515
startlat = 50.79747
azimuth = 165.
great(m,startlon, startlat, azimuth, color='orange', lw=2.0)
great(m,startlon, startlat, azimuth+180., color='orange', lw=2.0)

plt.savefig('tutorial08.png',dpi=300)

plt.show()


Dear Thomas,
This tutorial is great and very helpful. Thank you.
Best regards,
Ricardo
Hi!
Nice tutorials you have for Basemap.
By the way. I am trying to draw some great circles that cross longitude 180 (or -180, as you want to see it). So my map has the borders at longitudes -220 an -45 and when I try to draw a great circle from west of longitude 180 to west of longitude 180, the great circles are not great circles but strange lines. Any idea of how to fix this?
Thanx!
Juan
sorry I mean from west of longitude -180 to east of longitude -180…