The Jacknife is also sometimes called the “Leave One Out” method, and is a method to somehow evaluate the stability of statistics done on data. By leaving one element out of the input array and studying the mean of the values, one can identify outliers. Here is a small Python implementation, generalised to “Leave N Out”:
import numpy as np
import numpy.ma as ma

def jacknife(data, jack_reject=1):
    """ This function takes an *array*, generates *jack_reject *random indexes
    to reject and returns *jacknifed_data* containing len(data)-jack_reject
    elements

    Parameters
    ----------
    data : numpy.ndarray
        Contains the 1D array of input
    jack_reject : int
        The number of elements to randomly reject

    Returns
    -------
    jacknifed_data : numpy.ndarray
        The input *data* with *jack_reject* elements removed

    """
    indexes = np.random.randint(0,len(data), jack_reject)
    while len(np.unique(indexes)) != len(indexes):
        remain = len(indexes) - len(np.unique(indexes))
        indexes = np.concatenate((np.unique(indexes),
                                  np.random.randint(0,len(data),remain)))
    mask = np.array([False] * len(data))
    mask[indexes] = True
    jacknifed_data = ma.array(data,mask=mask).compressed()
    return jacknifed_data
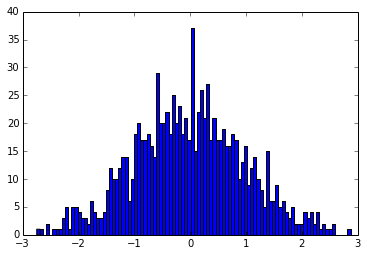
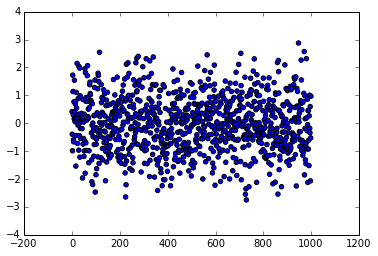
Now, some tests! Let’s generate a normal distribution of elements, centered on 0 and with a standard deviation of 1 (those are the default values to scipy.stats.norm()):
from scipy.stats import norm
rv = norm()
data = rv.rvs(1000)
plt.figure()
plt.hist(data,bins=100)
plt.figure()
plt.scatter(np.arange(len(data)),data)
gives:
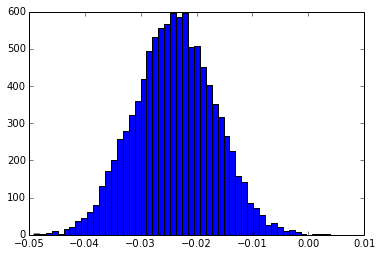
And then, calculating 10.000 means of the data by jacknife-ing 50 elements:
means = []
for i in range(10000):
    means.append( jacknife(data,50).mean() )
plt.hist(means,bins=50)
Which shows that our normal distribution is centered on -0.023986 rather than on 0 ! In this example, we rejected 5% of the elements!
There are surely more nice statistics to do on this example! I’m looking forward to seeing suggestions in the comments!
References:


