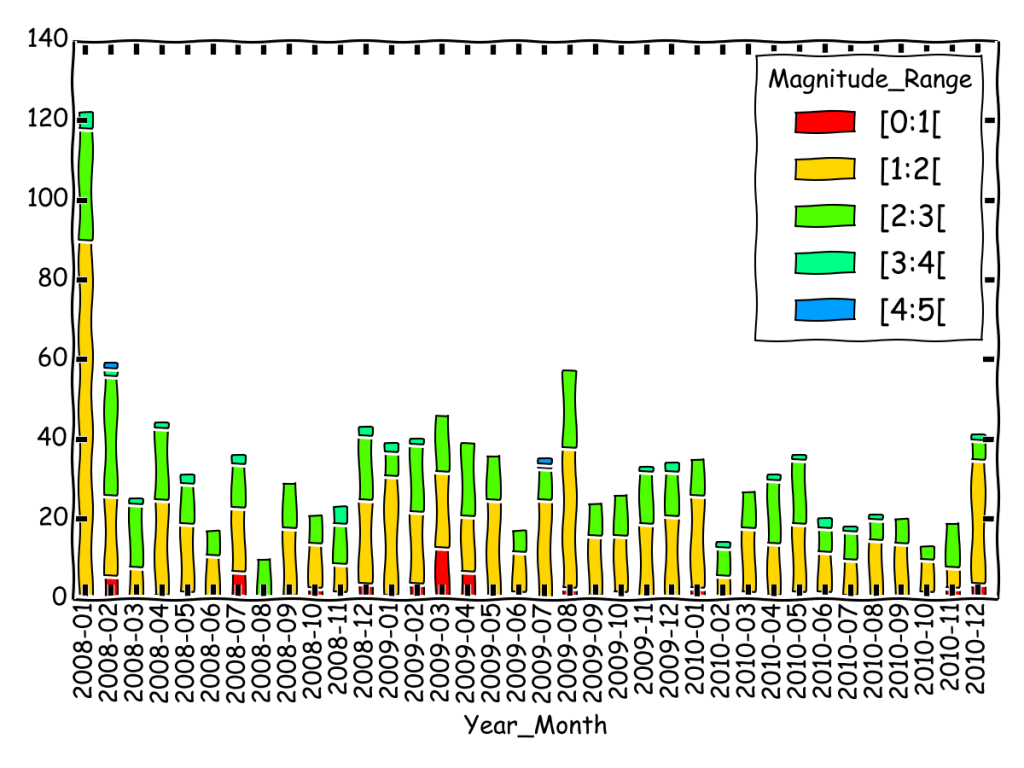
Pandas and Obspy are incredible pieces of software that definitively make my life easier ! In this tutorial, we will get seismic Event data from IRIS using Obspy, then analyse the catalog using Pandas, to end up with a “Seismicity Rate” per month, splitting events in magnitude bins, graphically speaking:
To get the data, we will use the obspy.iris package:
from obspy.iris import Client
from obspy.core import UTCDateTime
c = Client()
try:
    cat = pickle.load(open( "save.p", "rb" ))
except:
    cat = c.getEvents(  minlat=48,maxlat=52,minlon=-1,maxlon=10,
                    starttime=UTCDateTime("2008-01-01"),endtime=UTCDateTime("2011-01-01"),
                    minmag=0.0)
    pickle.dump(cat,open( "save.p", "wb" ))
Note we test to check that we already have saved the data on the disk (saves time and bandwidth). Once done, we have a “Catalog” object, containing all events:
>>>print cat
1190 Event(s) in Catalog:
2010-12-31T04:16:27.500000Z | +48.051,   +7.952 | 1.5 ML
2010-12-28T20:41:00.600000Z | +48.939,   +8.088 | 1.8 ML
...
2008-01-02T08:31:25.000000Z | +49.352,   +6.809 | 2.4 ML
2008-01-01T17:42:14.600000Z | +49.339,   +6.771 | 2.2 ML
We will just process a little this catalog to create lists usable in pandas (I hoped there was a cat.to_dataframe() method):
times = []
lats = []
lons = []
deps = []
magnitudes = []
magnitudestype = []
for event in cat:
    if len(event.origins) != 0 and len(event.magnitudes) != 0:
        times.append(event.origins[0].time.datetime)
        lats.append(event.origins[0].latitude)
        lons.append(event.origins[0].longitude)
        deps.append(event.origins[0].depth)
        magnitudes.append(event.magnitudes[0].mag)
        magnitudestype.append(event.magnitudes[0].magnitude_type )
and create the DataFrame containing the Catalog:
df = pd.DataFrame({'lat':lats,'lon':lons,'depth':deps,
                   'mag':magnitudes,'type':magnitudestype},
                  index = times)
which gives :
>>>print df.head()
                            depth      lat     lon  mag type
2010-12-31 04:16:27.500000    3.0  48.0509  7.9525  1.5   ML
2010-12-28 20:41:00.600000   10.0  48.9392  8.0876  1.8   ML
2010-12-25 16:53:30.300000    7.0  49.5863  7.1554  1.9   ML
2010-12-23 05:52:46.300000   17.1  49.9924  8.1570  2.7   ML
2010-12-23 01:35:56.750000   16.4  49.9954  8.1606  3.4   ML
Now, we need to define bins for the magnitudes, plus labels and colours for plotting:
bins = np.arange(-1,7)
labels = np.array(["[%i:%i["%(i,i+1) for i in bins])
colors = [cm.hsv(float(i+1)/(len(bins)-1)) for i in bins]
Then, we define a new column in the DataFrame, and give the index of the bin each line’s magnitude corresponds to:
df['Magnitude_Range'] = pd.cut(df['mag'], bins=bins, labels=False)
this gives:
>>>print df.head()
                            depth      lat     lon  mag type  Magnitude_Range
2010-12-31 04:16:27.500000    3.0  48.0509  7.9525  1.5   ML                2
2010-12-28 20:41:00.600000   10.0  48.9392  8.0876  1.8   ML                2
2010-12-25 16:53:30.300000    7.0  49.5863  7.1554  1.9   ML                2
2010-12-23 05:52:46.300000   17.1  49.9924  8.1570  2.7   ML                3
2010-12-23 01:35:56.750000   16.4  49.9954  8.1606  3.4   ML                4
Indexes are OK, but labels are nicer, so we just replace the value:
df['Magnitude_Range'] = labels[df['Magnitude_Range']]
that gives:
>>>print df.head()
                            depth      lat     lon  mag type Magnitude_Range
2010-12-31 04:16:27.500000    3.0  48.0509  7.9525  1.5   ML           [1:2[
2010-12-28 20:41:00.600000   10.0  48.9392  8.0876  1.8   ML           [1:2[
2010-12-25 16:53:30.300000    7.0  49.5863  7.1554  1.9   ML           [1:2[
2010-12-23 05:52:46.300000   17.1  49.9924  8.1570  2.7   ML           [2:3[
2010-12-23 01:35:56.750000   16.4  49.9954  8.1606  3.4   ML           [3:4[
we need an extra column to group by year-month:
df['Year_Month'] = [di.strftime('%Y-%m') for di in df.index]
and finally, we can count the number of different magnitudes per year-month:
rate = pd.crosstab(df.Year_Month, df.Magnitude_Range)
that gives:
>>>print rate.head()
Magnitude_Range  [0:1[  [1:2[  [2:3[  [3:4[  [4:5[
Year_Month
2008-01              0     90     28      4      0
2008-02              6     20     30      2      1
2008-03              0      8     16      1      0
2008-04              1     24     18      1      0
2008-05              2     17     10      2      0
and plot it:
rate.plot(kind='bar',stacked=True,color=colors)
Voilàààààà 🙂
Note: the fancy sketchy style of the plot comes with the new backend provided in matplotlib! Check it out, it’s great for doing figures for presentations!
The full code is after the break:
#
# Pandas Obspy example by geophysique.be
# Seismicity Rate per Month-Year
#

import numpy as np
import matplotlib.pyplot as plt
import matplotlib.cm as cm
import datetime
import pandas as pd
import pickle

plt.xkcd()

from obspy.iris import Client
from obspy.core import UTCDateTime
c = Client()
try:
    cat = pickle.load(open( "save.p", "rb" ))
except:
    cat = c.getEvents(  minlat=48,maxlat=52,minlon=-1,maxlon=10,
                    starttime=UTCDateTime("2008-01-01"),endtime=UTCDateTime("2011-01-01"),
                    minmag=0.0)
    pickle.dump(cat,open( "save.p", "wb" ))

times = []
lats = []
lons = []
deps = []
magnitudes = []
magnitudestype = []
for event in cat:
    if len(event.origins) != 0 and len(event.magnitudes) != 0:
        times.append(event.origins[0].time.datetime)
        lats.append(event.origins[0].latitude)
        lons.append(event.origins[0].longitude)
        deps.append(event.origins[0].depth)
        magnitudes.append(event.magnitudes[0].mag)
        magnitudestype.append(event.magnitudes[0].magnitude_type )

df = pd.DataFrame({'lat':lats,'lon':lons,'depth':deps,
                   'mag':magnitudes,'type':magnitudestype},
                  index = times)

bins = np.arange(-1,7)
labels = np.array(["[%i:%i["%(i,i+1) for i in bins])
colors = [cm.hsv(float(i+1)/(len(bins)-1)) for i in bins]
df['Magnitude_Range'] = pd.cut(df['mag'], bins=bins, labels=False)
df['Magnitude_Range'] = labels[df['Magnitude_Range']]
df['Year_Month'] = [di.strftime('%Y-%m') for di in df.index]

rate = pd.crosstab(df.Year_Month, df.Magnitude_Range)
rate.plot(kind='bar',stacked=True,color=colors)

plt.tight_layout()
plt.savefig('Seismicity Rate.png',dpi=150)
plt.show()


Another way (more pythonic?) of filling up your list would be to use list comprehension on a filtered catalog, i.e.:
cat_filter = [event for event in cat

        if len(event.origins) != 0 and len(event.magnitudes) != 0]
times = [event.origins[0].time.datetime for event in cat_filter]
lats = [event.origins[0].latitude for event in cat_filter]
lons = [event.origins[0].longitude for event in cat_filter]
deps = [event.origins[0].depth for event in cat_filter]
magnitudes = [event.magnitudes[0].mag for event in cat_filter]
magnitudestype = [event.magnitudes[0].magnitude_type for event in cat_filter]
Nice one! How about constructing a generator ? 🙂
Toujours lá quand on en a besoin ce site! Merci!