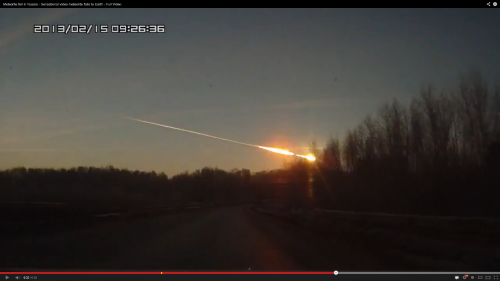
Very early this morning, a meteor lit up the skies of Russia, somewhere close to Ekaterinburg.
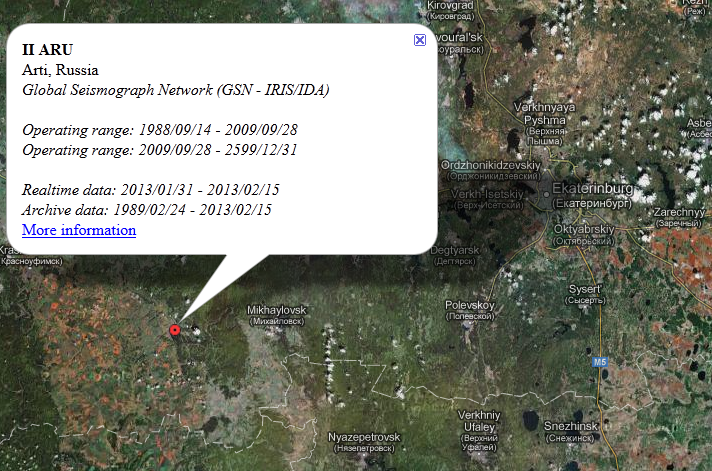
Same as for the Korean Boom Boom, we wanted to have a look at the seismic data of a close-by station to check if something was visible. The closest IRIS seismic station to this place is II.ARU (see location), at a distance of roughly 135 km.
One BHZ component is available on an STS-1 seismometer.To know the timestamp of the “event”, i took a guess that the overlay on the video was correct, and once corrected for the timezone, gave 03:26 UTC. Then, the easy part, getting data from IRIS :
from obspy.iris import Client
comp ="BHZ"
client = Client()
t1 = UTCDateTime("2013-02-15 03:00:00")
st = client.getWaveform("II", "ARU", "00", comp, t1 , t1 + 3600)
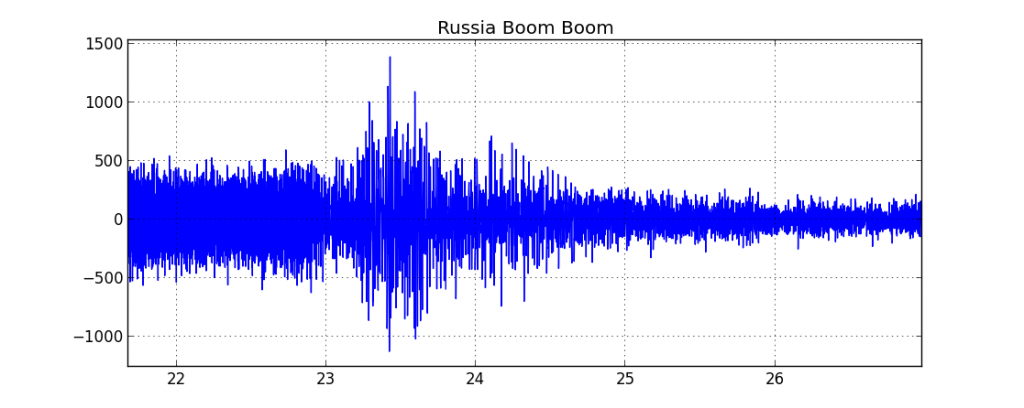
one gets:
or, high-pass filtered above 1 Hz:
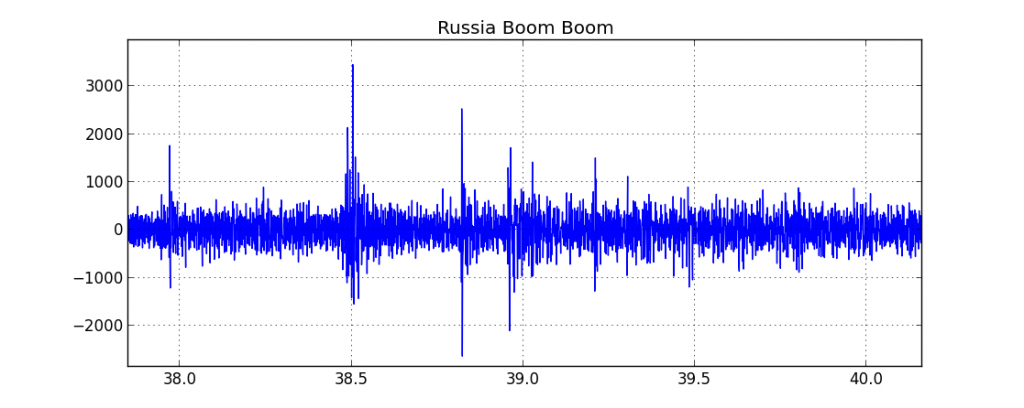
There are two clear signals at 23 min and 38 min, but I have *no* idea if those are related to the meteor, its sonic boom(s), a potential impact with the ground, any-thing! If you have ideas, please share in the comments section below !
Finally, two close-ups of the higher amplitude stuff:
EDIT:
A M5.7 earthquake occurred in Tonga at 03:02:21.1, using obspy’s implementation of TauP, I get:
from obspy.taup.taup import getTravelTimes
from obspy.core import UTCDateTime
import pyproj
slat =56.43
slon =58.56

t0 = UTCDateTime("2013-02-15 03:02:21.1")
elat = -19.77
elon = 174.07
edep = 77

gc = pyproj.Geod(ellps='WGS84')
az1,az2,d2 = gc.inv(elon,elat,slon,slat)
km2deg = 40075.016686 / 360. #This is WGS84 norm
d = d2/(km2deg*1e3)
distance_units="deg"
tt = getTravelTimes(d, edep, model='ak135')
if tt:
    for tti in tt:
        print tti['phase_name'],t0+tti['time']
arrival times:
     Pdiff 2013-02-15T03:17:27.424402Z
    pPdiff 2013-02-15T03:17:48.467493Z
    sPdiff 2013-02-15T03:17:56.730005Z
     PKPdf 2013-02-15T03:21:03.121484Z
     PKiKP 2013-02-15T03:21:03.211206Z
    pPKPdf 2013-02-15T03:21:24.910425Z
    pPKiKP 2013-02-15T03:21:24.993921Z
    sPKPdf 2013-02-15T03:21:33.009302Z
    sPKiKP 2013-02-15T03:21:33.094141Z
        PP 2013-02-15T03:22:29.301294Z
     SKPdf 2013-02-15T03:24:31.683740Z
     SKiKP 2013-02-15T03:24:32.054101Z
     PKSdf 2013-02-15T03:24:39.782373Z
     SKSac 2013-02-15T03:27:53.448022Z
     SKSdf 2013-02-15T03:28:08.284570Z
    pSKSac 2013-02-15T03:28:23.035425Z
    sSKSac 2013-02-15T03:28:31.218286Z
    pSKSdf 2013-02-15T03:28:38.175683Z
    sSKSdf 2013-02-15T03:28:46.273706Z
    SKKSac 2013-02-15T03:29:22.002222Z
     Sdiff 2013-02-15T03:30:14.318506Z
    pSdiff 2013-02-15T03:30:41.697168Z
    sSdiff 2013-02-15T03:30:50.556787Z
    PKKPbc 2013-02-15T03:31:10.561548Z
    PKKPab 2013-02-15T03:31:12.351709Z
    PKKPdf 2013-02-15T03:31:42.770532Z
        SP 2013-02-15T03:32:11.134790Z
        PS 2013-02-15T03:32:20.137964Z
    SKKPbc 2013-02-15T03:34:51.262353Z
    PKKSbc 2013-02-15T03:34:59.426904Z
    SKKPdf 2013-02-15T03:35:11.194726Z
    PKKSdf 2013-02-15T03:35:19.292139Z
    SKKSac 2013-02-15T03:38:36.127588Z
    SKKSdf 2013-02-15T03:38:47.644678Z
        SS 2013-02-15T03:38:50.680566Z
    P'P'df 2013-02-15T03:39:54.882959Z
    S'S'ac 2013-02-15T03:53:42.594873Z
    S'S'df 2013-02-15T03:54:13.323633Z
and, plotting those:
doesn’t explain all the peaks visible… Ideas, guys ?






Cool stuff! Nice how one can get so easily real measurement data! Did you get some feedback on your 2 events in the meantime?
Hi ! Thanks!
No, not really. There are some resources online that have discussed the records too: