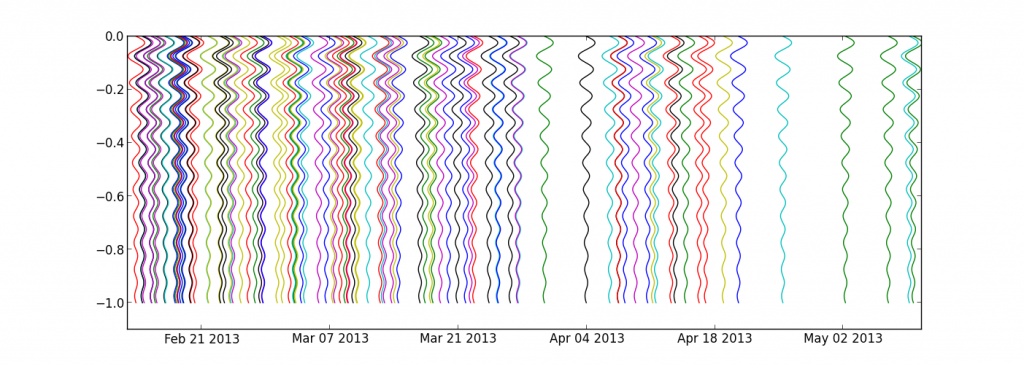
Following a question from my dear colleague Devy, here is how to plot a set of events, occurring at random moments in time. The idea is to plot the waveform of each event with the beginning at the top and the end at the bottom (along the “y” axis) and centred on the origin time of the event (x axis is thus a datetime axis). To illustrate the example, let’s get a decreasing sinusoid :
import numpy as np
import matplotlib.pyplot as plt

f = 10
t  = np.linspace(0,1.,1000)
y = np.sin(t*2*np.pi*f) * np.exp(-t)**2

plt.plot(t,y)
plt.show()
then, flip it and convert the y data to a time-aware amplitude:
import datetime
t0 = datetime.datetime.now()
yd = [t0 + datetime.timedelta(days=yi) for yi in y]
plt.plot(yd,-t)
plt.ylim(-t[-1]-1,0)
plt.show()
and finally, get 100 of those, irregularly placed in time:
for i in np.random.randint(0,100,100)*np.random.random(100):
    t0 = datetime.datetime.now() + + datetime.timedelta(days=i)
    yd = [t0 + datetime.timedelta(days=yi) for yi in y]
    plt.plot(yd,-t)

plt.ylim(-t[-1]*1.1,0)
plt.show()
Voilàààà, happy coding, Dev’ !
import numpy as np
import matplotlib.pyplot as plt

f = 10
t  = np.linspace(0,1.,1000)
y = np.sin(t*2*np.pi*f) * np.exp(-t)**2

plt.plot(t,y)
plt.show()

import datetime
t0 = datetime.datetime.now()
yd = [t0 + datetime.timedelta(days=yi) for yi in y]
plt.plot(yd,-t)
plt.ylim(-t[-1]-1,0)
plt.show()

for i in np.random.randint(0,100,100)*np.random.random(100):
    t0 = datetime.datetime.now() + + datetime.timedelta(days=i)
    yd = [t0 + datetime.timedelta(days=yi) for yi in y]
    plt.plot(yd,-t)

plt.ylim(-t[-1]*1.1,0)
plt.show()
The full code is after the break:


thanks mate 🙂