We needed to execute an old-but-working 16bits program to locate earthquakes called “HypoEllipse” (source), but calling it from the Windows 7 x64 boxes resulted in a nice : Bam ! Not working, sorry for you… No ! I say No…

Thomas Lecocq @ the Royal Observatory of Belgium
We needed to execute an old-but-working 16bits program to locate earthquakes called “HypoEllipse” (source), but calling it from the Windows 7 x64 boxes resulted in a nice : Bam ! Not working, sorry for you… No ! I say No…

Very early this morning, a meteor lit up the skies of Russia, somewhere close to Ekaterinburg. Same as for the Korean Boom Boom, we wanted to have a look at the seismic data of a close-by station to check if…
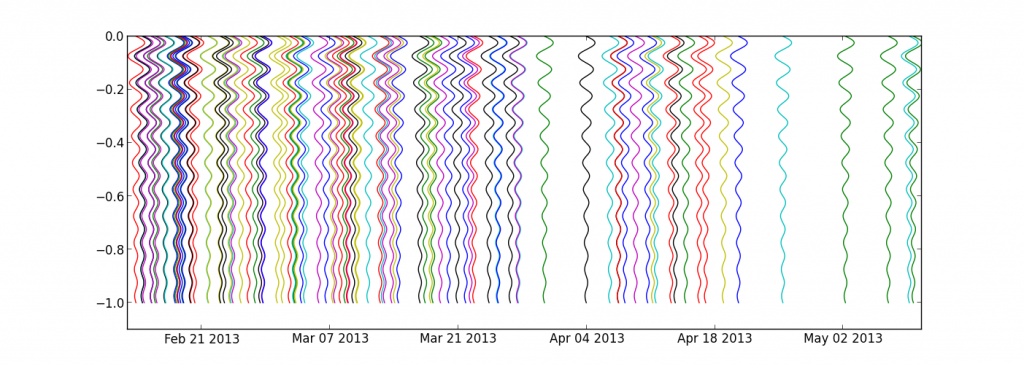
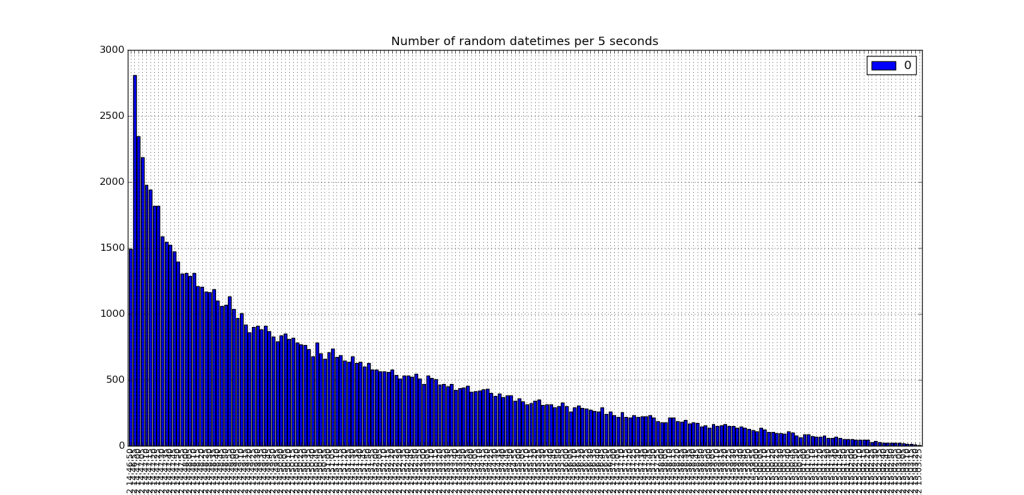
Following a question from my dear colleague Devy, here is how to plot a set of events, occurring at random moments in time. The idea is to plot the waveform of each event with the beginning at the top and…
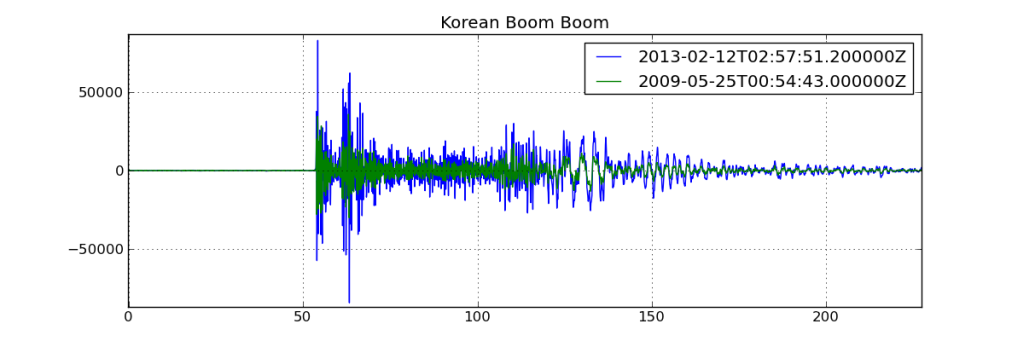
This morning, North Korea tested some nuclear “bomb” somewhere in the middle of the country (confirmed by Pyongyang officials and CTBTO), and many seismic sensors worldwide recorded the triggered waveforms. The location of the test is the same as the…
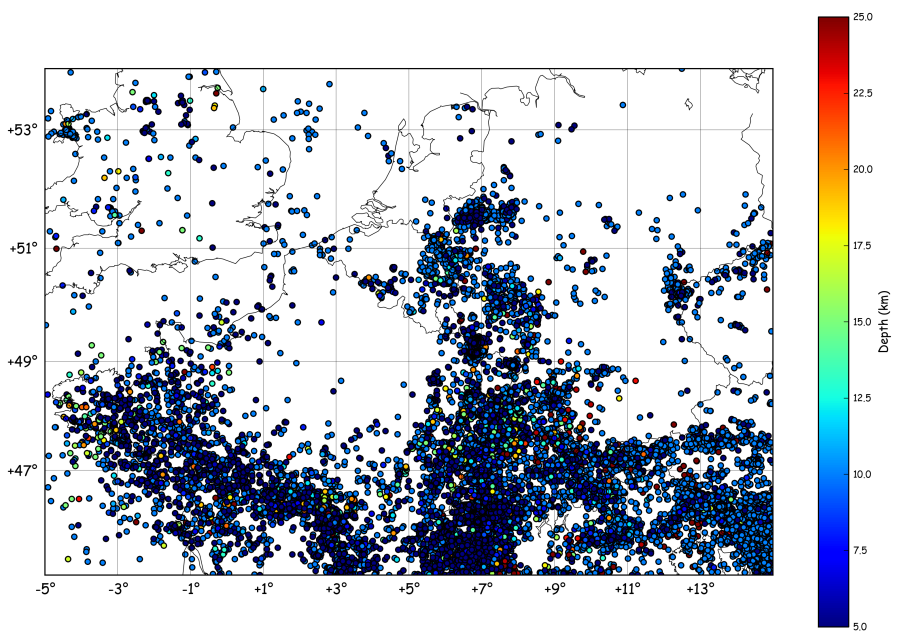
Imagine we want to plot a map of the seismic activity in NW-Europe and, at the same time, count the number events per month. To get a catalogue of earthquakes in the region, one can call the NEIC (note: this…
In the coming months, I’ll prepare some tutorials over an excellent data analysis package called pandas ! To show you the power of pandas, just take a look at this old tutorial, where I exploited the power of itertools to…

Following the comments on this year-old post I’ve had a look at pyshp which seems a little more maintained (the last line in the changelog is 1 year old…), and it is indeed a quite nice piece of code. I…