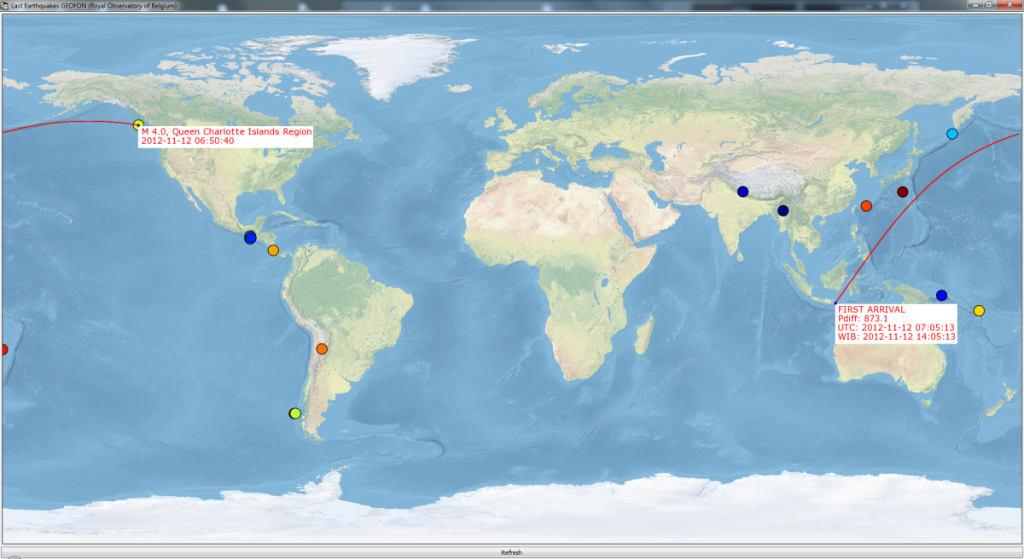
While in Indonesia last July, I created a small tool for the Kawah Ijen observers to allow them to search and plot teleseismic events and to calculate theoretical arrival times of the waves at the Ijen stations. It took roughly 2 hours to have a working version of the software, with:
- a GUI to plot a world map from Natural Earth Data (you’ll have to resize it to 5400×2700), or from True Marble Imagery
- get last earthquakes from GEOFON website
- interactively plot the earthquake and the shortest path to the Ijen stations
- calculate the travel time with the excellent obspy package and their port of taup
- show the time in UTC and local (WIB)
This, of course, would have been impossible (to me) to do as fast without the Enthought Tool Suite !
The final result is great :
The great circle is drawn from the data output by the mpl_toolkit.Basemap package, which is corrected for the window-border effect (yes, that annoying line parallel to the equator that come on your Basemaps) and redrawn on the Chaco canvas. The earthquakes are a scatter plot and the ScatterInspectorOverlay handles the mouse events. A refresh button is available at the bottom to fetch the latest GEOFON earthquakes! Done!
The full code is after the Break:
from chaco.api import ArrayPlotData, Plot, PlotAxis, ImageData, PlotLabel, \
    VPlotContainer, PlotGraphicsContext, LinePlot, Plot, jet
from chaco.tools.api import PanTool, ZoomTool, ScatterInspector, DataLabelTool
from chaco.api import ScatterInspectorOverlay, DataLabel

from obspy.core.util.geodetics import gps2DistAzimuth, kilometer2degrees
from obspy.taup.taup import getTravelTimes

from traits.api import *
from traitsui.api import *
from enable.api import ComponentEditor

from kiva.fonttools import Font

from feedparser import parse

import numpy as np
import datetime
from mpl_toolkits.basemap import Basemap

import sys

class LastQuakes(HasTraits):

    plotData = Any
    refresh = Button
    backImg=Instance(Plot)
    view=View(Item("backImg",
            editor=ComponentEditor(),
            show_label=False,
            visible_when="imageVisible==True"
            ), Item('refresh',show_label=False),
        height=1200,width=800,resizable=True,title="Last Earthquakes GEOFON (Royal Observatory of Belgium)")

    def _refresh_fired(self):
        x = []
        y = []
        c = []

        feed = parse('http://geofon.gfz-potsdam.de/eqinfo/list.php?datemin=&datemax=&latmin=&latmax=&lonmin=&lonmax=&magmin=4.&nmax=100&fmt=rss')
        self.entries = feed['entries']
        clen = len(self.entries)

        for i, entry in enumerate(self.entries):
            edate, etime, elat, elon, edep, eunit, estatus = entry['summary'].split()
            x.append( ((float(elon)+180)/360) * 5400.0)
            y.append(2700-((float(elat)+90)/180) * 2700.0)
            c.append(clen - i)

        self.plotData.set_data("X", x)
        self.plotData.set_data("Y", y)
        self.plotData.set_data("C", c)

        self.backImg.plot(("X", "Y", "C"),
            type="cmap_scatter",
            color_mapper=jet,
            marker="circle",
            index_sort="ascending",
            color="orange",
            marker_size=10,
            bgcolor="white",
            name="earthquakes")

    def __init__(self):
        self.plotData=ArrayPlotData()
        self.backImg=Plot(self.plotData, default_origin="top left")
        self.backImg.x_axis=None
        self.backImg.y_axis=None
        self.backImg.padding=(3, 3, 3, 3)
        image=ImageData.fromfile("world.png")
        self.plotData.set_data("imagedata", image._data)
        self.backImg.img_plot("imagedata")

        self.image=True
        self.imageVisible=True
        #TMP
        x = []
        y = []
        c = []

        feed = parse('http://geofon.gfz-potsdam.de/eqinfo/list.php?datemin=&datemax=&latmin=&latmax=&lonmin=&lonmax=&magmin=5.&nmax=100&fmt=rss')
        self.entries = feed['entries']
        clen = len(self.entries)

        for i, entry in enumerate(self.entries):
            edate, etime, elat, elon, edep, eunit, estatus = entry['summary'].split()
            x.append( ((float(elon)+180)/360) * 5400.0)
            y.append(2700-((float(elat)+90)/180) * 2700.0)
            c.append(clen - i)

        self.plotData.set_data("X", x)
        self.plotData.set_data("Y", y)
        self.plotData.set_data("C", c)

        self.backImg.plot(("X", "Y", "C"),
            type="cmap_scatter",
            color_mapper=jet,
            marker="circle",
            index_sort="ascending",
            color="orange",
            marker_size=10,
            bgcolor="white",
            name="earthquakes")
        my_plot = self.backImg.plots["earthquakes"][0]
        my_plot.tools.append(ScatterInspector(my_plot, selection_mode="toggle",
        persistent_hover=False))
        my_plot.overlays.append(
            ScatterInspectorOverlay(my_plot,
            hover_color = "transparent",
            hover_marker_size = 10,
            hover_outline_color = "purple",
            hover_line_width = 2,
            selection_marker_size = 8,
            selection_color = "lawngreen")
        )
        zoom=ZoomTool(component=my_plot, tool_mode="box", always_on=False)
        my_plot.overlays.append(zoom)

        pan=PanTool(my_plot)
        my_plot.tools.append(pan)

        self.index_datasource = my_plot.index
        self.index_datasource.on_trait_change(self._metadata_handler,
                                              "metadata_changed")
        self.map = Basemap()

    def _metadata_handler(self):
        sel_indices = self.index_datasource.metadata.get('selections', [])
        if len(sel_indices) != 0:
            self.index_datasource.metadata.clear()
            #~ print sel_indices[0]
            #~ print self.entries[sel_indices[0]]
            edate, etime, elat, elon, edep, eunit, estatus = self.entries[sel_indices[0]]['summary'].split()
            elat = float(elat)
            elon = float(elon)
            edep = float(edep)

            ex,ey = self.toxy(elon,elat)
            greats = self.great(elon,elat)

            for i, great in enumerate(greats):
                lons, lats = great
                x,y = self.toxy(lons,lats)
                self.plotData.set_data('EQX%i'%i,x)
                self.plotData.set_data('EQY%i'%i,y)
                self.backImg.plot(('EQX%i'%i,'EQY%i'%i),type='line',color='red',linewidth=5.0)
            if len(greats) == 1:
                self.plotData.set_data('EQX1',[])
                self.plotData.set_data('EQY1', [])
                self.backImg.plot(('EQX1','EQY1'),type='line',color='red',linewidth=5.0)

            lon_ij, lat_ij =  [(114 + 14.0/60.0 + 22.19/3600.0) , -( 8.0 + 3.0/60. + 43.92/3600.0)]
            ijx, ijy = self.toxy(lon_ij, lat_ij)

            delta = gps2DistAzimuth(elat,elon,lat_ij, lon_ij)[0]
            delta = kilometer2degrees(delta/1000.)
            tt = getTravelTimes(delta, edep, model='iasp91')
            text = "FIRST ARRIVAL\n"
            first = tt[0]
            text += "%s: %.1f\n" % (first['phase_name'],first['time'])

            arriv = datetime.datetime.strptime("%s %s" % (edate, etime),"%Y-%m-%d %H:%M:%S") + datetime.timedelta(seconds=int(first['time']))
            text += "UTC: %s\n" % arriv
            text += "WIB: %s" % (arriv+datetime.timedelta(hours=7))

            f = Font(size=16)
            del self.backImg.overlays[:]

            label1 = DataLabel(component=self.backImg,
                            data_point=(ijx, ijy),
                            label_text= text,
                            show_label_coords = False,
                            text_color = "red",
                            font = f,
                           label_position="bottom right",
                           border_visible=False,
                           bgcolor="white",
                           marker_color="blue",
                           marker_line_color="transparent",
                           marker = "diamond",
                           arrow_visible=False)
            self.backImg.overlays.append(label1)

            event = self.entries[sel_indices[0]]['title'] + '\n'
            event += "%s %s" % (edate, etime)

            label2 = DataLabel(component=self.backImg,
                            data_point=(ex,ey),
                            label_text= event,
                            show_label_coords = False,
                            text_color = "red",
                            font = f,
                           label_position="bottom right",
                           border_visible=False,
                           bgcolor="white",
                           marker_color="blue",
                           marker_line_color="transparent",
                           marker = "diamond",
                           arrow_visible=False)
            self.backImg.overlays.append(label2)

    def toxy(self, lon, lat):
        x = (((lon+180)/360) * 5400.0)
        y = (2700-((lat+90)/180) * 2700.0)
        return x,y

    def great(self, elon, elat):
        lon_ij, lat_ij =  [(114 + 14.0/60.0 + 22.19/3600.0) , -( 8.0 + 3.0/60. + 43.92/3600.0)]
        p = self.map.drawgreatcircle(elon, elat, lon_ij, lat_ij)[0]
        lons = np.array(p.get_xdata())
        lats = np.array(p.get_ydata())

        hemi = np.where(lons[1:]-lons[:-1] > 50)[0]
        greats = []
        if len(hemi) != 0:
            greats.append([ lons[:hemi+1] , lats[:hemi+1] ])
            greats.append([ lons[hemi+1:] , lats[hemi+1:] ])
        else:
            greats.append([lons, lats])
        return greats

lq = LastQuakes()

lq.configure_traits()
sys.exit()


Many thanks for sharing, this and your other examples are very good starting points for learning how to use python in a scientific environment!
For running the example, could you post a link to your world.png, I think it needs to be a specific size (5400 x 2700) Premade world maps at that size I found on: http://www.unearthedoutdoors.net/global_data/true_marble/download
Hi ! Thanks for your comment ! I updated the post to include the link!