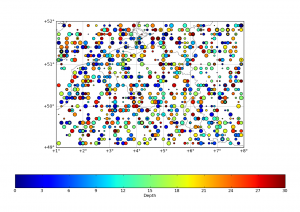
Now, let’s imagine we have a dataset containing latitude/longitudes of earthquakes, plus their depth and magnitude. Of course, you don’t always have this dataset available, so let’s build a fake one :
import numpy as np
lon = np.random.random_integers(11,79,1000)/10.
lat = np.random.random_integers(491,519,1000)/10.
depth = np.random.random_integers(0,300,1000)/10.
magnitude = np.random.random_integers(0,100,1000)/10.
We create random integer values, and we devide each of the the 1000-element array by 10.0.
Then, time is to convert from lat/lon world to matplotlib canvas world :
# with x,y=m(lon,lat) we calculate the x,y position of each quake in the map coordinates
x,y = m(lon,lat)
And finaly, to plot the earthquakes, with a color scale linked to the depth, and the size of the scatter point linked to the magnitude (in fact, 10 times the magnitude, in order to see something):
x,y = m(lon,lat)
m.scatter(x,y,s=10*magnitude,c=depth)
See the full code after the break ;
#

# BaseMap example by geophysique.be

# tutorial 02

from mpl_toolkits.basemap import Basemap

import matplotlib.pyplot as plt

import numpy as np

fig = plt.figure(figsize=(11.7,8.3))

#Custom adjust of the subplots
plt.subplots_adjust(left=0.05,right=0.95,top=0.90,bottom=0.05,wspace=0.15,hspace=0.05)
ax = plt.subplot(111)

#Let's create a basemap around Belgium
m = Basemap(resolution='i',projection='merc', llcrnrlat=49.0,urcrnrlat=52.0,llcrnrlon=1.,urcrnrlon=8.0,lat_ts=51.0)
m.drawcountries(linewidth=0.5)
m.drawcoastlines(linewidth=0.5)
m.drawparallels(np.arange(49.,53.,1.),labels=[1,0,0,0],color='black',dashes=[1,0],labelstyle='+/-',linewidth=0.2) # draw parallels
m.drawmeridians(np.arange(1.,9.,1.),labels=[0,0,0,1],color='black',dashes=[1,0],labelstyle='+/-',linewidth=0.2) # draw meridians

lon = np.random.random_integers(11,79,1000)/10.
lat = np.random.random_integers(491,519,1000)/10.
depth = np.random.random_integers(0,300,1000)/10.
magnitude = np.random.random_integers(0,100,1000)/10.
# with x,y=m(lon,lat) we calculate the x,y position of each quake in the map coordinates
x,y = m(lon,lat)
m.scatter(x,y,s=10*magnitude,c=depth) # we will scale the dots by 10 time the magnitude
c = plt.colorbar(orientation='horizontal')
c.set_label("Depth")
plt.show()


