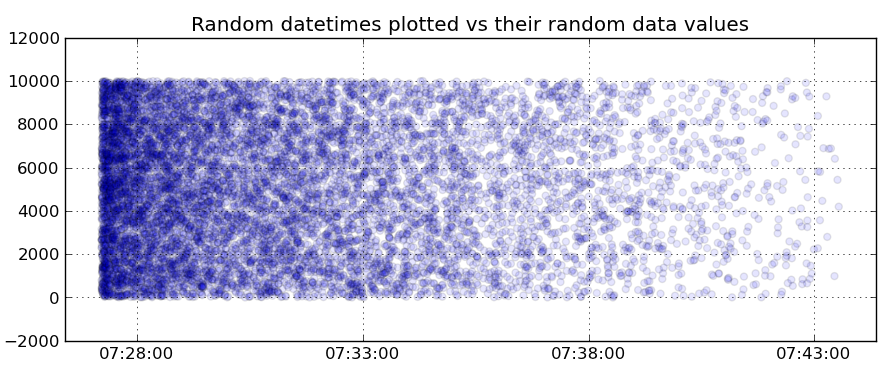
To extend the previous tutorial (see here), we define a data array that has some information about the event that occurred for each datetime. The plot of data vs time now looks like:
The data array is constructed with numpy.random:
data = np.random.randint(10000,size=len(times))
Now, we will modify the example from tutorial 03:
def group(di):
    return int(calendar.timegm(di.timetuple()))/binning

list_of_dates = np.array(times,dtype=datetime.datetime)
grouped_dates = [[datetime.datetime(*time.gmtime(d*binning)[:6]), len(list(g))] for d,g in itertools.groupby(list_of_dates, group)]
grouped_dates = zip(*grouped_dates)
and instead of taking the number of occurrences with len(list(g)), we define an analysis method to do some clever stuff on g:
def group(di):
    return int(calendar.timegm(di.timetuple()))/binning

def analyse(gi):
    indexes = np.array([np.where(list_of_dates == di)[0] for di in list(gi)]).ravel()
    return np.mean(data[indexes])

grouped_dates = [[datetime.datetime(*time.gmtime(d*binning)[:6]), analyse(g)] for d,g in itertools.groupby(list_of_dates, group)]
grouped_dates = zip(*grouped_dates)
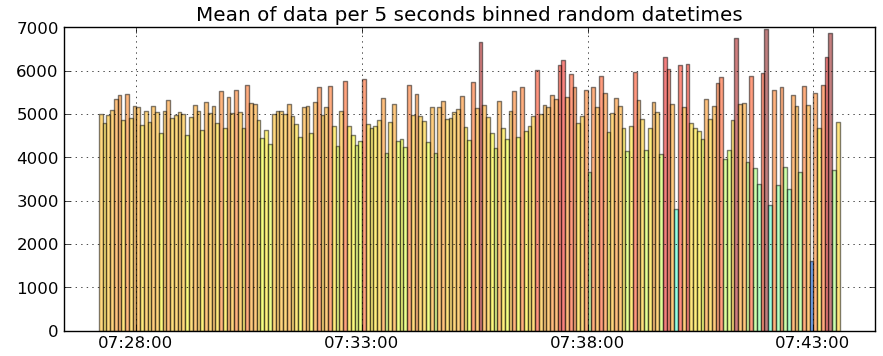
Analyse gets the iterable as argument, which gets converted to a list and we build an array of the indexes of each datetime. This indexes array is then used to select items in the data array, and the mean of this is returned. The final plot will look like :
Note that we plot the bars with a facecolor proportional to the data value (using import matplotlib.cm as cm):
ax = plt.subplot(212,sharex=ax)
bars = plt.bar(grouped_dates[0],grouped_dates[1],width=float(binning)/DAY)
for r,bar in zip(grouped_dates[1], bars):
    bar.set_facecolor(cm.jet(float(r)/np.amax(grouped_dates[1])))
    bar.set_alpha(0.5)
ax.xaxis_date()
plt.grid(True)
plt.title('Mean of data per %i seconds binned random datetimes' % binning)
Voilà !
The full code is after the break:
import numpy as np
import matplotlib.pyplot as plt
import datetime, time, calendar
from matplotlib.dates import num2date, DateFormatter
import matplotlib.cm as cm
import itertools

N = 10000
starttime = time.time()
basetimes = sorted(np.random.random(N)*np.random.random(N)*1.0e3+starttime)
times = [datetime.datetime(*time.gmtime(a)[:7]) for a in basetimes]
for i, atime in enumerate(times):
    times[i] = atime + datetime.timedelta(microseconds=(basetimes[i]-int(basetimes[i])) * 1e6)

list_of_dates = np.array(times,dtype=datetime.datetime)
data = np.random.randint(10000,size=len(times))

SECOND = 1
MINUTE = SECOND * 60
HOUR = MINUTE * 60
DAY = HOUR * 24

binning = 5*SECOND

def group(di):
    return int(calendar.timegm(di.timetuple()))/binning

def analyse(gi):
    indexes = np.array([np.where(list_of_dates == di)[0] for di in list(gi)]).ravel()
    return np.mean(data[indexes])

grouped_dates = [[datetime.datetime(*time.gmtime(d*binning)[:6]), analyse(g)] for d,g in itertools.groupby(list_of_dates, group)]
grouped_dates = zip(*grouped_dates)

#Let's plot !
fig = plt.figure()

ax = plt.subplot(211)
plt.scatter(times,data,alpha=0.1)
ax.xaxis_date()
plt.grid(True)
plt.title('Random datetimes plotted vs their random data values')

ax = plt.subplot(212,sharex=ax)
bars = plt.bar(grouped_dates[0],grouped_dates[1],width=float(binning)/DAY)
for r,bar in zip(grouped_dates[1], bars):
    bar.set_facecolor(cm.jet(float(r)/np.amax(grouped_dates[1])))
    bar.set_alpha(0.5)
ax.xaxis_date()
plt.grid(True)
plt.title('Mean of data per %i seconds binned random datetimes' % binning)

plt.show()


